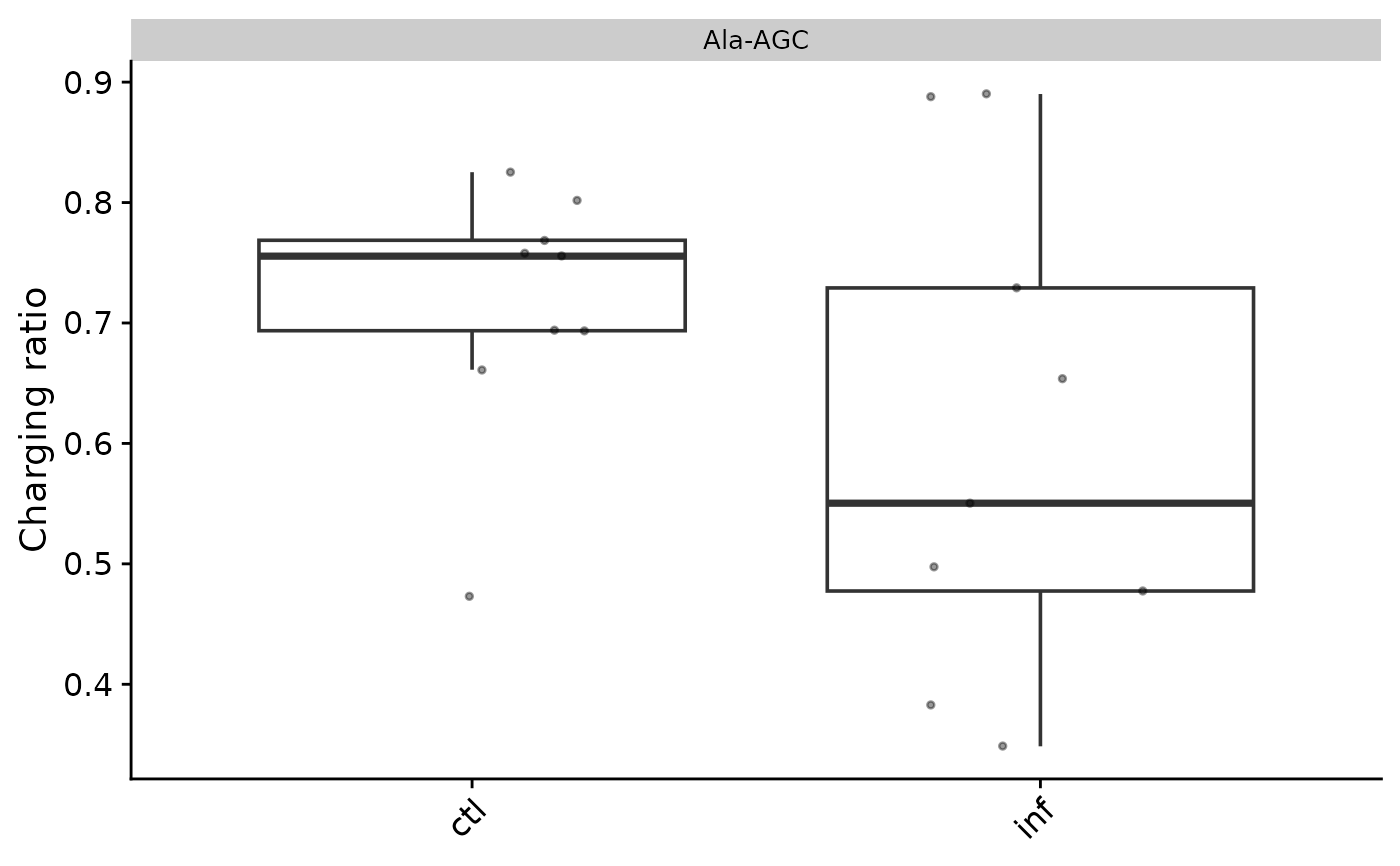
Create a box-and-jitter plot of raw charging ratios grouped by
condition. Expects the tibble stored in
metadata(se)$charging_ratios.
Usage
plot_charging_ratios(
  data,
  group_col = "condition",
  facet_col = NULL,
  shorten = TRUE,
  point_size = 0.8,
  point_alpha = 0.4
)
Arguments
- data
A tibble with at least
ref,charging_ratio, and the column named bygroup_col.- group_col
Column name (string) for the x-axis grouping variable (e.g.,
"condition"). Default"condition".- facet_col
Optional column name (string) for faceting (e.g.,
"strain"). DefaultNULL.- shorten
Logical; if
TRUE(default), shorten tRNA names on the y-axis viashorten_trna_names().- point_size
Numeric size for
ggplot2::geom_jitter(). Default0.8.- point_alpha
Numeric alpha for jittered points. Default
0.4.